Have you ever been editing and suddenly experienced déjà-vu? You know, that feeling that you’ve read the material before. And I don’t mean several weeks or even days ago. I mean really recently. Don’t worry. You’re probably not suffering from posttraumatic editing syndrome. Often authors duplicate material by presenting it in both table and text forms. This is a no-no. As the AMA Manual of Style states, “The same data usually should not be duplicated in a table and a figure or in the text” (§4, Visual Presentation of Data, p 81 in print). Of course, some overlap is to be expected, but extensive duplication of data in tables and text is a waste of space and the reader’s time.
This month’s style quiz on creating tables and figures asks the user to create a figure and a table from text. There are only 2 exercises, so I’m not going to give 1 away here. Instead, here’s a bonus exercise for you to try.
Directions: Use the information in the following paragraph to create a table that can replace the text. Refer to section 4.1 of the AMA Manual of Style.
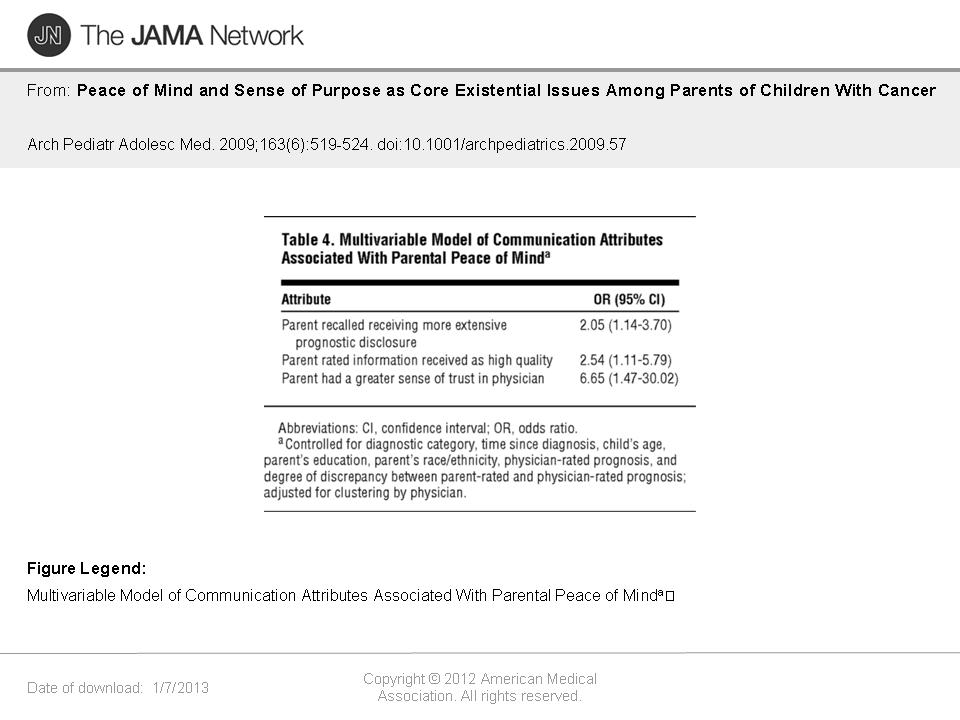
In a multivariable model of communication attributes associated with parental peace of mind (controlled for diagnostic category, time since diagnosis, child’s age, parent’s education, parent’s race/ethnicity, physician-rated prognosis, and degree of discrepancy between parent-rated and physician-rated prognosis; adjusted for clustering by physician), the odds ratios (95% confidence intervals) were as follows: 2.05 (1.14-3.70) for parent recalled receiving more extensive prognostic disclosure, 2.54 (1.11-5.79) for parent rated information received as high quality, and 6.65 (1.47-30.02) for parent had a greater sense of trust in physician.
Now, of course, there are several ways to reformat this sentence into a table, but here’s what we published (it was table 4 in this article). (Click for bigness.)
If you want more experience reformatting text into tables or figures, take this month’s quiz at www.amamanualofstyle.com—Laura King, MA, ELS
Amazing. At my company, duplication of text and tables/graphs (slide presentations with notes pages) is 50% of what we produce. Hmmmm