Forest Plots: The Basics

When I was recently asked to give a presentation on forest plots at work, I was less than enthused. Figures are my least favorite part of a manuscript to edit because they usually require a lot of tedious work, and determining how to best visually present statistics makes my brain hurt. Forest plots in particular had become the subject of my nightmares leading up to the time of preparation of my presentation after a few experiences with editing unwieldy ones. However, thanks to being subjected to presenting on forest plots, I’ve gained some basic knowledge that I thought I would share.

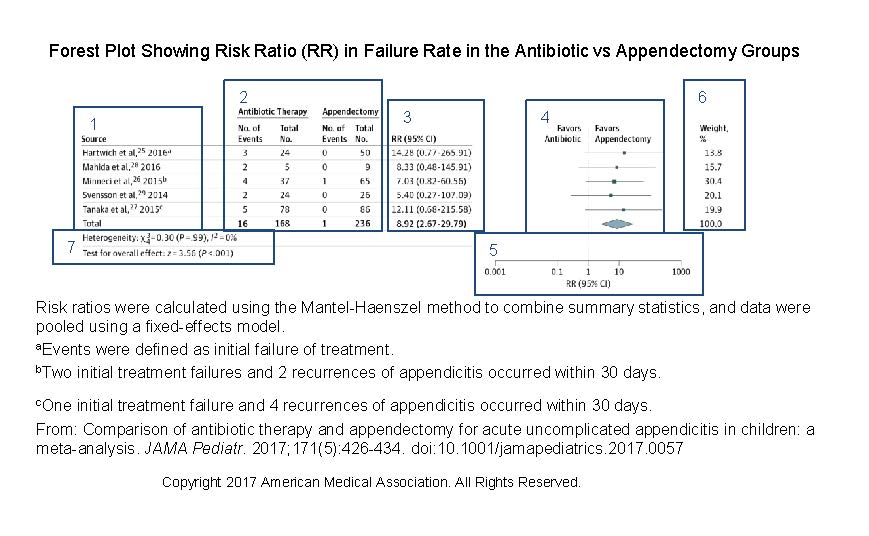
There are a few types of forest plots, namely those presenting the results of meta-analyses and those presenting subgroup analyses. Here, I will focus on a forest plot for a meta-analysis. In a meta-analysis, a forest plot acts as a visual representation of the results of the individual studies and the overall result of the analysis. It also shows overall effect estimates and study heterogeneity (ie, variation in results in the individual studies). A forest plot for ratio data should include the following data:

  1. The sources included in the meta-analysis, with citations. If the source author or study name is listed more than once, query the author to ensure that the study samples are unique; overlapping samples would lead to inaccurate estimates. Also, remember to renumber the references if you have renumbered them in the body of the article.
  2. The number of events and total number of participants in each group of the study and in the combined studies.
  3. Risk ratio and 95% CI for each study and overall.
  4. Graphed relative risk and 95% CI, with top labels describing what data markers on either side of the null line mean. The squares represent the results of each study and are centered on the point estimate, with the horizontal line in the center representing the 95% CI. The diamond shows the overall meta-analysis estimate, with the center representing the pooled estimate and the horizontal tips indicating the confidence limits.
  5. Log scale for the x axis with a label indicating the measure.
  6. Percentage of weight given to the study. Weights are given when pooled results are presented. Studies with narrower confidence intervals are weighted more heavily.
  7. Heterogeneity and data on overall effect.

(Open image in a new tab to see more detail.)

The caption should indicate the test and model (fixed or random effects) used in the evaluation and may include an explanation of the meaning of the different marker sizes.

If you follow these basic rules, forest plots are a breeze. —Sara M. Billings


Questions From Users of the Manual

126291-simple-black-square-icon-alphanumeric-percent-sign

Q: I appreciate the difference between percentile and percentage, but can you shed light on the difference between percentile and centile?

A: Ed Livingston, MD, a JAMA deputy editor and author of the statistics chapter in the 11th edition of our style manual, responds:

Percentile refers to the percentage below which a group of observations fall, ie, 93 percentile means that 93% of the observations fell below that value. If I had a score that was in the 85th percentile, I had a score that was better than 85% of all people taking that test.

Centile refers to which group an observation belongs to when the population is divided into 100 equal groups, like a quartile. With a quartile there are 4 equal-sized groups and with a centile there are 100 equal-sized groups—so in practice it’s the same as a percentile. —Cheryl Iverson, MA

Questions From Users of the Manual

Q: Should “least squares mean” be hyphenated? Can the acronym LSM be used or is LS preferred?

A: In the glossary in the statistics chapter, you’ll see that there is no hyphen used in “least squares method,” so I would extrapolate from that to say no hyphen is required in “least squares mean.” If this term comes up so frequently in the manuscript that you feel an abbreviation is warranted, we indicate no preference for what that abbreviation is. Just be sure it’s used consistently throughout.—Cheryl Iverson, MA

Quiz Yourself

Number needed to treat (NNT) is the number of patients who must be treated with an intervention for a specific period to prevent 1 bad outcome or result in 1 good outcome. What is the reciprocal of the NNT? Use your mouse to highlight the answer:

Absolute risk reduction, which is the proportion in the control group experiencing an event minus the proportion in the intervention group experiencing an event, is the reciprocal of the NNT.

See §20.9 for a Glossary of Statistical Terms.—Laura King, MA, MFA, ELS

Putting P Values in Their Place

Although I am not a statistician, I find something very appealing about mathematics and statistics and am pleased when I find a source to help me understand some of the concepts involved. One of these sources intersects with my obsession with politics: Nate Silver’s website fivethirtyeight.com. Yesterday, during a scan of fivethirtyeight’s recent posts, this one by Christie Ashwanden caught my eye: “Statisticians Found One Thing They Can Agree On: It’s Time to Stop Misusing P-Values.”

P values and data in general are frequently on the minds of manuscript editors at the JAMA Network. Instead of just making sure that statistical significance is defined and P values provided, we always ask for odds ratios or 95% confidence intervals to go with them. P values are just not enough anymore, and Ashwanden’s article was really useful in helping me understand why these additional data are needed (as well as making me feel better about not fully understanding the definition of a P value—it turns out I’m not alone. According to another fivethirtyeight article, “Not Even Scientists Can Easily Explain P-Values”). One of the bad things about relying on P values alone is that they are used as a “litmus test” for publication. Findings with low P values but not contextual data are published, yet important studies with high P values are not—and this has real scientific and medical consequences. These articles explain why P values only can  be a cause for concern.

And then there was even more information about statistical significance to think about. A colleague shared a link to a story on vox.com by Julia Belluz: “An Unhealthy Obsession With P-Values Is Ruining Science.” This article a discussed a recent report in JAMA  by Chavalarias et al “that should make any nerd think twice about p-values.” The recent “epidemic” of statistical significance means that “as p-values have become more popular, they’ve also become more meaningless.” Belluz also provides a useful example of what a P value will and will not tell researchers in, say, a drug study, and wraps up with highlights of the American Statistical Association’s guide to using P values.—Karen Boyd

Quiz Yourself

Do you know the difference between the terms multivariable and multivariate? One term refers to multiple predictors (independent variables) for a single outcome (dependent variable), and the other term refers to 1 or more independent variables for multiple outcomes? Which is which?

ANSWER:

Multivariable refers to multiple predictors (independent variables) for a single outcome (dependent variable). Multivariate refers to 1 or more independent variables for multiple outcomes. Therefore, analyses can be described as multivariable, to indicate the number of predictors, or as multivariate, to indicate the type of outcome.—Laura King, ELS

Questions From Users of the Manual

Q: If there is a column for P values in a table and if a P value “straddles” rows (eg, provides the P value for men vs women), how should this be shown?

A: There are several options, with option 1 being preferred:

1. Center the P value between the items it compares (eg, between the values for men and women) and consider the use of a side brace.

2. If only 2 items are being compared, list the P value on the line giving the overall category (eg, Sex).

3. Use footnotes to indicate the P value for items being compared (eg, use a superscript “a” next to the value for men and the value for women and indicate the P value for this comparison in a footnote labeled “a”).

Q: If some of the confidence intervals given in a table column include negative values, how do you combine the minus sign and the hyphen that would normally be used in such a range in a table?

A: With ranges that include a minus sign, use to to express the range, rather than a hyphen. Carry this style throughout the entire table, even for those values that do not include a minus sign.—Cheryl Iverson, MA

Significant and Significance

If there is any doubt about whether significant/significance refers to statistical significance, clinical significance, or simply something “important” or “noteworthy,” choose another word or include a modifier that removes any ambiguity for the reader.

The AMA Manual of Style (§20.9, Glossary of Statistical Terms, pp 893-894 in print) includes definitions for statistical significance (the testing of the null hypothesis of no difference between groups; a significant result rejects the null hypothesis) and clinical significance (involves a judgment as to whether the risk factor or intervention studied would affect a patient’s outcome enough to make a difference for the patient; may be used interchangeably with clinical importance). Significant and significance also are used in more general contexts to describe worthiness or importance.

Often the context in which the word appears will make the meaning clear:

▪ Statistical Significance:

• Exposure to the health care system was a significant protective factor for exclusive throat carriage of Staphylococcus aureus (odds ratio, 0.67; P = .001).

• Most associations remained statistically significant at the adjusted significance level (P < .125).

▪ Clinical Significance:

• Low creatinine values in patients with connective tissue diseases were found to be clinically significant.

• The combination of erythromycin and carbamazepine represents a clinically significant drug interaction and should be avoided when possible.

▪ Worthy/Important:

• His appointment as chair of the department was a significant victory for those who appreciated his skill in teaching.

• A journal’s 100th anniversary is significant and should be celebrated.

Sometimes, however, the context does not clarify the meaning and ambiguity results.

▪ The one truly significant adverse effect that has caused carbon dioxide resurfacing to lose favor is hypopigmentation, which can be unpredictable and resistant to treatment.

To avoid the possibility of ambiguity, some have recommended confining the word to only one of its meanings. However, why cheat a word of one of its legitimate meanings when there are ways to retain its richness and yet not confuse the reader?—Cheryl Iverson, MA

Bucking the “Trend” and Approaching “Approaching Significance”

I believe we are on an irreversible trend toward more freedom and democracy – but that could change.

—Dan Quayle

In general usage, the concept of trend implies movement. Not only is this implied in its definitions, but the word can be traced to its Middle High German root of trendel, which is a disk or spinning top.1

In scientific writing, when is a trend not a trend? When it is not referring to comparisons of findings across an ordered series of categories or across periods of time. However, this and related terms are often misused in manuscripts and articles.

Most studies are constructed as hypothesis testing. Because an individual study only provides a point estimate of the truth, the researchers must determine before conducting the study an acceptable cutoff for the probability that a finding of an association is due to chance (the α value, most commonly but not universally set at .05 in clinical studies). This creates a dichotomous situation in interpreting the result: the study either does or does not meet this criterion. If the criterion is met, the finding is described as “statistically significant”; if it is not met, the finding is described as “not statistically significant.”

There are many limitations to this approach. Where the α level is set is arbitrary; therefore, in general all findings should be expressed as the study’s point estimate and confidence interval, rather than just the study estimate and the P value. Despite the limitations, if a researcher designs a study on the basis of hypothesis testing, it is not appropriate to change the rules after the results are available, and the results should be interpreted accordingly. The entire study design (such as calculation of the sample size and study power – the ability of a study to detect an actual difference or effect, if one truly exists) is dependent on setting the rules in advance and adhering to them.

If a study does not meet the significance criterion (for example, if the α level was set as < .05, and the P value for the finding was .08), authors sometimes describe the findings as “trending toward significance,” “having a trend toward significance,” “approaching significance,” “borderline significant,” or “nearly significant.” None of these terms is correct. Results do not trend toward significant—they either are or are not statistically significant based on the prespecified study assumptions. Similarly, the results do not include any movement and so cannot “approach” significance; and because of the dichotomous definition, “nearly significant” is no more meaningful than “nearly pregnant.”

When a finding does not meet statistical significance, there are generally 2 possible explanations: (1) There is no real association. (2) There might be an association, but the study was underpowered to detect it, usually because there were not enough participants or outcome events. A finding that does not meet statistical significance may still be clinically important and warrant further consideration.

However, when authors use terms such as trend or approaching significance, they are hedging the interpretation. In effect, they are treating the findings as if the association were statistically significant, or as if it might have been if the study had just gone a little differently. This is not justified. (Lang and Secic2 make the fascinating observation that “Curiously, P values never seem to ‘trend’ away from significance.”)

A proper use of the term trend refers to the results of one of the specific statistical tests for trend, the purpose of which is to estimate the likelihood that differences across 3 or more groups move (increase or decrease) in a meaningful direction more than would be expected by chance. For example, if a population of persons is ranked by evenly divided quintiles based on serum cholesterol level (from lowest to highest), and the risk of subsequent myocardial infarction is measured in each group, the researcher may want to determine whether risk increases in a linear way across the groups. Statistical tests that might be used for analyzing trends include the χ2 test for trend and the Cochran-Armitage test.

Similarly, a researcher may want to test for a directional movement in the values of data over time, such as a month-to-month decrease in prescriptions of a medication following publication of an article describing major adverse effects. A number of analytic approaches can be used for this, including time series and other regression models.

Instead of using these terms, the options are:

1. Delete the reported finding if it is not clinically important or a primary outcome. OR

2. Report the finding with its P value. Describe the result as “not statistically significant,” or “a statistically nonsignificant reduction/increase,” and provide the confidence interval so that the reader can judge whether insufficient power is a likely reason for the lack of statistical significance.

If the finding is considered clinically important, authors should discuss why they believe the results did not achieve statistical significance and provide support for this argument (for example, explaining how the study was underpowered). However, this type of discussion is an interpretation of the finding and should take place in the “Discussion” (or “Comment”) section, not in the “Results” section.

Bottom line:

1. The term trend should only be used when reporting the results of statistical tests for trend.

2. Other uses of trend or approaching significance should be removed and replaced with a simple statement of the findings and the phrase not statistically significant (or the equivalent). Confidence intervals, along with point estimates, should be provided whenever possible.—Robert M. Golub, MD

1. Mish FC, ed in chief. Merriam-Webster’s Collegiate Dictionary. 11th ed. Springfield, MA: Merriam-Webster Inc; 2003.

2. Lang TA, Secic M. How to Report Statistics in Medicine: Annotated Guidelines for Authors, Editors, and Publishers. 2nd ed. Philadelphia, PA: American College of Physicans; 2006:56, 58.