Have you ever been editing and suddenly experienced déjà-vu? You know, that feeling that you’ve read the material before. And I don’t mean several weeks or even days ago. I mean really recently. Don’t worry. You’re probably not suffering from posttraumatic editing syndrome. Often authors duplicate material by presenting it in both table and text forms. This is a no-no. As the AMA Manual of Style states, “The same data usually should not be duplicated in a table and a figure or in the text” (§4, Visual Presentation of Data, p 81 in print). Of course, some overlap is to be expected, but extensive duplication of data in tables and text is a waste of space and the reader’s time.
This month’s style quiz on creating tables and figures asks the user to create a figure and a table from text. There are only 2 exercises, so I’m not going to give 1 away here. Instead, here’s a bonus exercise for you to try.
Directions: Use the information in the following paragraph to create a table that can replace the text. Refer to section 4.1 of the AMA Manual of Style.
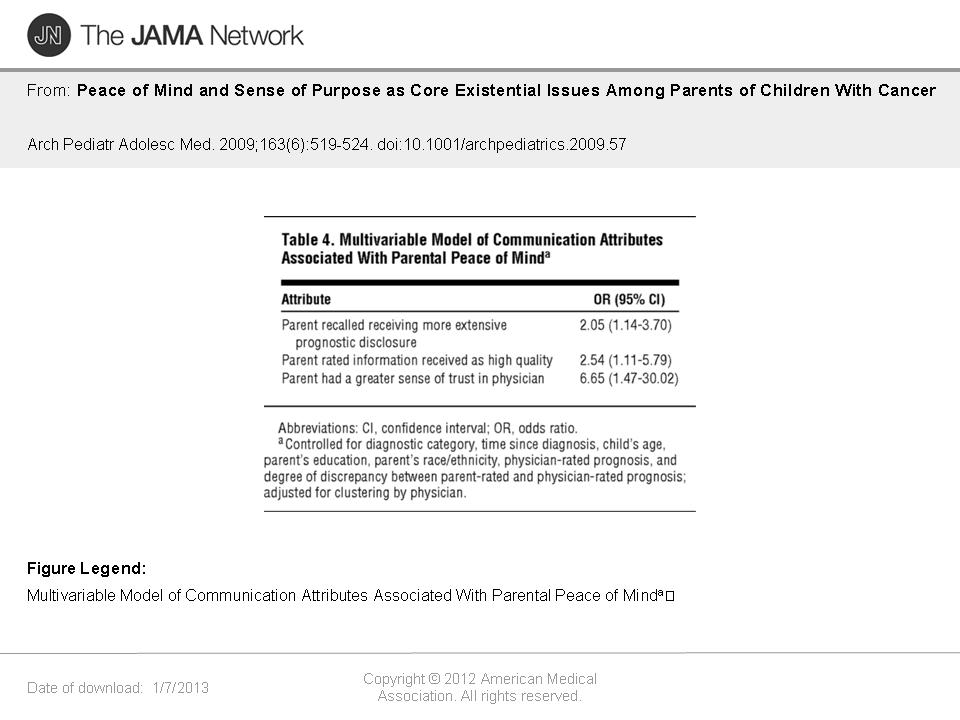
In a multivariable model of communication attributes associated with parental peace of mind (controlled for diagnostic category, time since diagnosis, child’s age, parent’s education, parent’s race/ethnicity, physician-rated prognosis, and degree of discrepancy between parent-rated and physician-rated prognosis; adjusted for clustering by physician), the odds ratios (95% confidence intervals) were as follows: 2.05 (1.14-3.70) for parent recalled receiving more extensive prognostic disclosure, 2.54 (1.11-5.79) for parent rated information received as high quality, and 6.65 (1.47-30.02) for parent had a greater sense of trust in physician.
Now, of course, there are several ways to reformat this sentence into a table, but here’s what we published (it was table 4 in this article). (Click for bigness.)
If you want more experience reformatting text into tables or figures, take this month’s quiz at www.amamanualofstyle.com—Laura King, MA, ELS

