Icons at the JAMA Network

Nancy Essex, Director, Brand Design, JAMA Network

Good things in small packages: JAMA Network visual abstract icons

Serena Williams. The Nike swoosh. The bald eagle.

What comes to mind when you think of the word “icon”? A tennis superstar, a ubiquitous consumer brand logo, a nation’s official symbol?

You’d be right, of course. When we use the word icon around JAMA Network lately, it usually suggests those adorable line drawings on our visual abstracts that represent some of your favorite things, like catheters, IV bags, and dermatitis.



(If you’re not familiar with visual abstracts, please visit this overview page. It’s ok, we’ll be here when you get back.)

What is an icon?

An icon can be defined as an emblem or symbol, a pictorial representation of a thing. We are all familiar with software icons, like the envelope, trash can, and folder. Icons are also important in wayfinding and signage–can you imagine being in an airport in a country whose language you don’t speak, trying to find the bathroom without them?

Icons need to be general enough so we don’t have to create a new one for each visual abstract. For instance, a torn meniscus and osteoarthritis of the knee could be represented by a single knee icon.

Of course, those conditions are completely different, but in the context of our visual abstracts, a simple knee icon is often all that’s needed to communicate the basic idea of knee condition.

Details make the design, but not too many details

Icons are an important part of the visual vocabulary used in visual abstracts. To keep everything consistent, we developed the following criteria to guide icon development:

  • Simplicity
    • When it comes to icons, the simpler the better. The viewer should almost be able to sight-read an icon, and so icons must be recognizable with as little detail as possible. Plus, they are small to begin with, so too much detail would make them unreadable blobs when viewed in context on Twitter, for instance.
  • Scale and size
    • Icons are created on a 72px square field— that’s just 1 square inch— to represent interventions, population, and conditions, and on a 32px square field for settings and locations. They are always used in the same size and never scaled up or down.
  • Line quality
    • Icons use a consistent 2px line weight throughout. On a few unavoidable occasions, a narrower line weight can be added for a necessary detail. A rounded end cap is used for the ends of lines to keep everything looking friendly.
  • Angles and corners
    • Because we never know which icons will be used side by side, it’s important to use harmonious and consistent angles and corner radii. This helps to maintain the organized and structured look of the visual abstract layout.
  • Monochromatic color palette
    • Color is kept to black line only. White and tan are used when possible to create an illusion of solidity, and after many requests, light gray has recently been approved for use to add another level of differentiation.
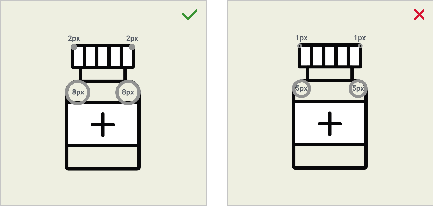
Some do’s and don’ts for visual abstract icons.

We strictly uphold these requirements for a few practical and aesthetic reasons: consistency, brand alignment, efficiency, and, importantly, visual elegance and sophistication.

The JAMA Network icon library has grown to include nearly 300 icons, from acne to radiography, and many things in between.

As you can imagine, it takes many talented people to complete a visual abstract. Manuscript editors, visual abstract editors, managing editors, production graphics, editorial graphics, designers, marketers, social media managers, administrators, and more—we all play a part.
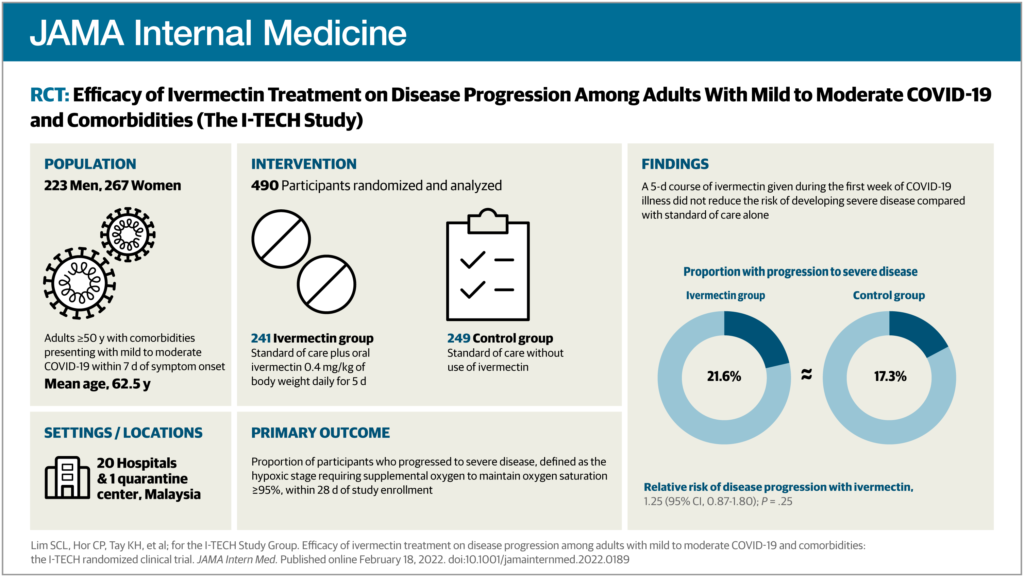
An example of a published JAMA Network visual abstract. For guidance on how to prepare figures for use in visual abstracts, please consult chapter 4.2.10 of the AMA Manual of Style.

JAMA Network Guidance on Venn Diagrams

Connie Manno, ELS, Director, Freelance Editing Unit, JAMA Network

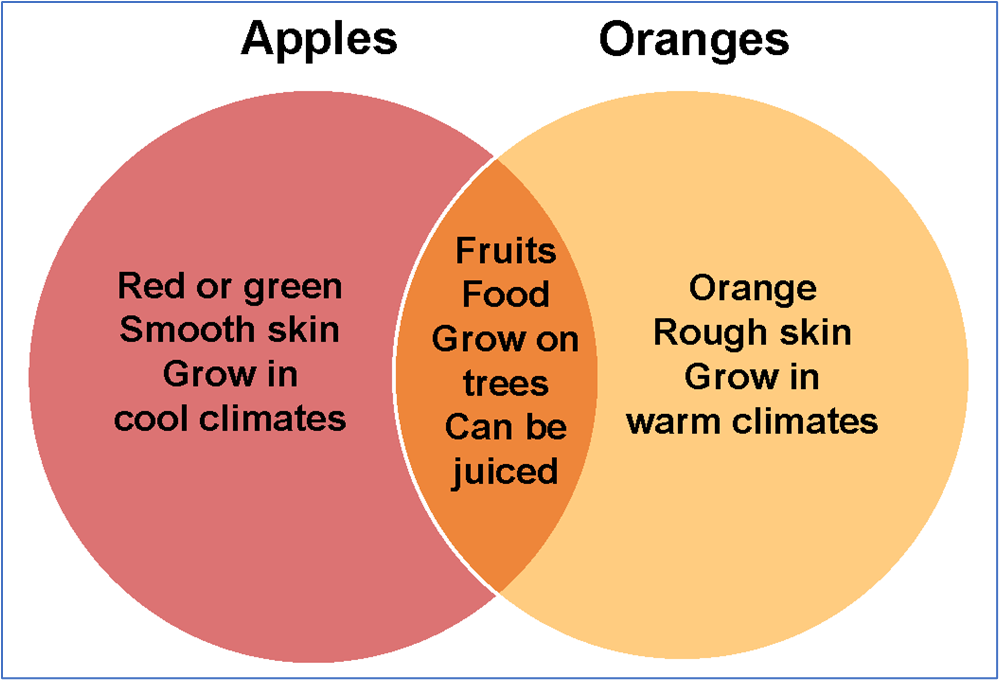
Venn diagrams are simple pictorial representations of relationships that exist between 2 or more sets of things. Circles that overlap have commonality; circles that do not overlap do not share traits.1

Although Venn diagrams represent conceptual shared or unique traits between separate ideas or groups of things (Figure 1), they are not appropriate to visualize numerical (empirical) data.2

Figure 1. Conceptual Venn Diagram

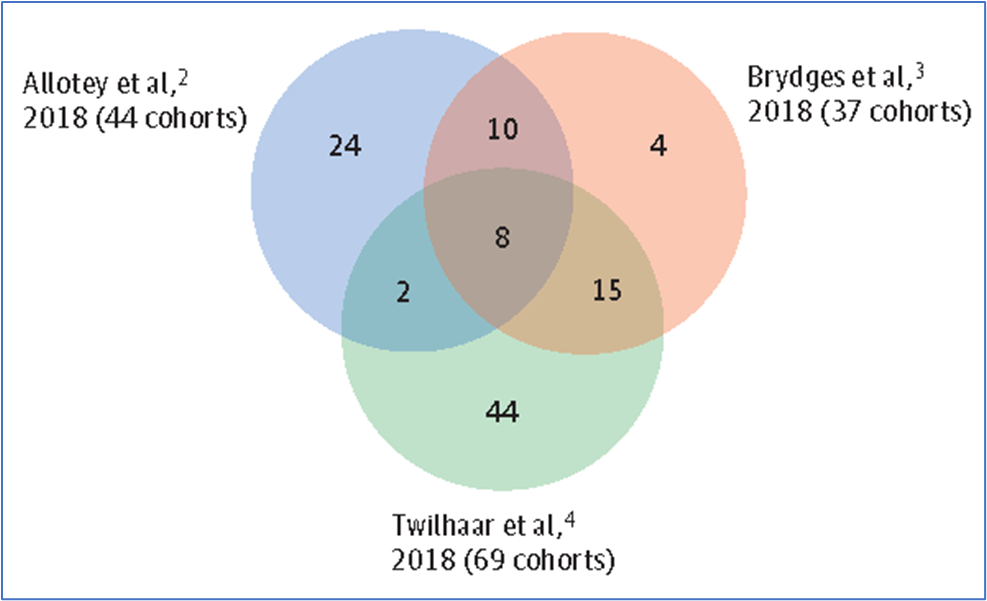
Often, the separate sets are presented as identically sized circles—even if the quantities in each set and the overlapping and nonoverlapping segments are different—and the resulting illustration can be not only imprecise but also misleading (Figure 2).3

Figure 2. Venn Diagram of Identically Sized Circles That Represent Different Quantities

The identically sized circles obscure the different numbers of cohorts included in the referenced studies. From Sentenac et al.3

Like pie charts, which also compare relationships among component parts and are frequently used to depict data for a lay audience, Venn diagrams should be avoided in scientific publications.4(pp137-138)

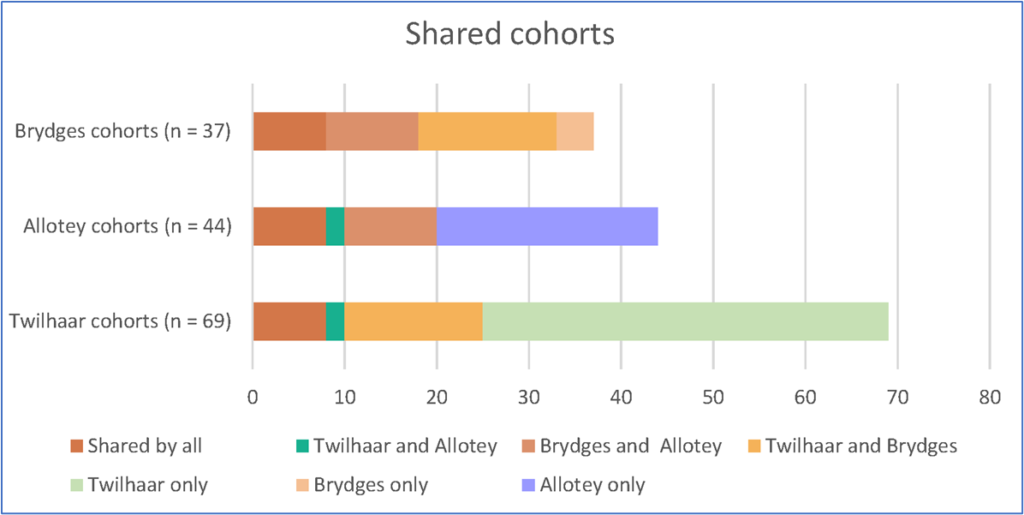
One more precise way to present the data is to create a bar graph or component bar graph (Figure 3), which can present the relationships between 2 or more data sets while illustrating the size difference between the sets with bars of unequal lengths. A component bar graph additionally uses color and section length to highlight patterns in the data.2

Figure 3. Data as a Component Bar Graph

When the data from Figure 2 are presented as a component bar graph, the difference in cohort sizes is apparent from the bar lengths. In addition, bar sections that depict shared segments use the same color.

Another option is to present the data in a matrix: a tabular structure that uses numbers, short words (eg, no, yes), symbols (eg, bullets, check marks), or shading to depict relationships among items in columns and rows and to allow comparisons among entries.4(p114)

Depending on the complexity of the construction and the need for multiple colors or shading, a matrix may be presented as a table or figure (Figure 4).

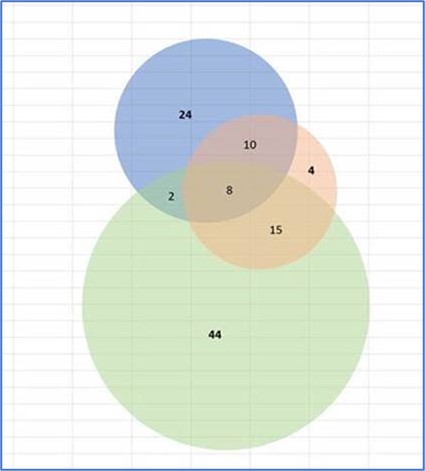
A third option is to resize the circles to make them more proportional to the quantities they represent (Figure 5), but only if the circles and overlaps are precise and generated from statistical software.

Figure 5. Circles From Figure 2 Resized to More Accurately Represent the Sample Sizes

This option must use precisely sized circles and overlaps generated from statistical software to ensure that the figure’s elements are truly proportional.

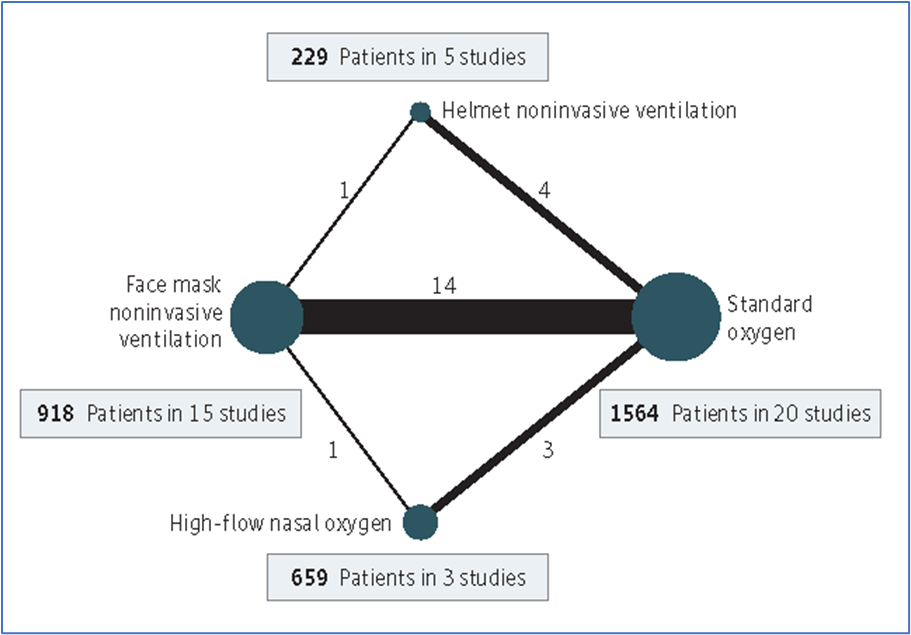
Network figures that use nodes and connecting lines of varying sizes to illustrate the proportions of the compared items are also useful for depicting relationships among 2 or more sets of data (Figure 6).5

Figure 6. Network Figure Depicting Relationships Among 4 Data Sets

In this network map, the size of the nodes is proportional to the number of participants in each node, and the thickness of the connecting lines is proportional to the number of randomized clinical trials in each comparison. From Ferreyro et al.5

Although data can be displayed multiple ways, accuracy and audience, as well as the criteria of the final format (eg, scientific journal vs consumer publication), should govern the decision of which option to use.

References

  1. Kenton W. Venn diagram. Investopedia website. Updated January 17, 2020. Accessed February 1, 2021. https://www.investopedia.com/terms/v/venn-diagram.asp
  2. Harris RM. Bar plots as Venn diagram alternatives. Rayna M. Harris blog. May 7, 2019. Accessed February 1, 2021. https://www.raynamharris.com/blog/vennbar/
  3. Sentenac M, Boutron I, Draper ES, et al. Defining very preterm populations for systematic reviews with meta-analyses. JAMA Pediatr. 2020;174(10):997-999. doi:10.1001/jamapediatrics.2020.0956
  4. Tables, figures, and multimedia. In: Christiansen S, Iverson C, Flanagin A, et al. AMA Manual of Style: A Guide for Authors and Editors. 11th ed. Oxford University Press; 2020:113-169.
  5. Ferreyro BL, Angriman F, Munshi L, et al. Association of noninvasive oxygenation strategies with all-cause mortality in adults with acute hypoxemic respiratory failure: a systematic review and meta-analysis. JAMA. 2020;324(1):57-67. doi:10.1001/jama.2020.9524

Common Mistakes in Submitted Images

The production graphics team at JAMA Network reimagines author art following AMA style guidelines. Our department is a fantastic resource to assist editors and authors with submission of art and reassure them that, with only a bit of tweaking, images can be not only press ready, but also meet journal style guidelines.

Because there are limited ways to present medical data graphically, we tend to see the same issues with author-provided art occur over and over again. Here is a short list of common submission errors to watch out for as editors before relaying an author’s images to your publication’s graphics department.

  • Plotting odds ratios as arithmetic instead of logarithmic.

Odds ratios need to be graphed on log scales, because plotting odds ratios on a linear scale is misleading.

  • Log scales that use half numbers.

Using half numbers on a log scale does not meet AMA style guidelines.

  • Failure to include tick marks with numbers on the x and/or y axis.

Our department reproduces author-submitted art to conform to style guidelines, and when art is submitted without ticks, it is sometimes difficult to align it with our templates.

  • Not providing vector art for Kaplan-Meier plots, forest plots, dot pots, or other plotted data.
  • Low-resolution images provided for photographic imagery.
  • Providing photographic imagery with text, arrows, A/B designators, or other types of callouts in the image area of the art.
  • Providing dot plots, scatter plots, and other types of images with inappropriate symbols.
  • Plotting mean values as bar graphs.

Bar charts are not an acceptable format for mean values and may only be used for frequency data (counts) only.

Our team’s goal is to work with editorial staff to produce images that support an article, are visually appealing, and produce the best possible results at press. Hopefully this information can aid authors and editors in submitting art to obtain these goals!–Carolyn Hall

An Interview With AMA Manual of Style Committee Member Connie Manno

With the recent release of the 11th edition of the AMA Manual of Style, I was curious to learn more about the members of the style committee, their background, and their experience working on the manual update. After all, these editorial masterminds spent countless hours debating every detail of AMA style to make our jobs as editors easier.

The first person with whom I chose to chat was Connie Manno, Director of the Freelance Editing Unit at JAMA Network and coauthor of chapter 4, Tables, Figures, and Multimedia. (Full disclosure—she’s my manager.)

Background

Connie started working as a coordinator in the freelance unit at the JAMA Network in 1998 after getting started with the organization as a freelance proofreader. In 2017, she was promoted to the director of the unit.

The freelance team currently consists of 5 in-house coordinators, 12 freelance editors, and 4 freelance copyreaders and is constantly growing. The team has doubled since Connie started in the unit to keep up with the increasing number of manuscripts and the greater amount of content published by the JAMA Network.

Expectations for Freelance Editors

When asked about the expectations of the freelance editors, Connie stated that the preference is for each to edit at least 3 major manuscript per week and to handle the initial set of author revisions. The editors are expected to take a substantive editing approach, with strict adherence to the AMA Manual of Style.

They are contacted at least monthly with updates to or reminders about journal style and policy. The coordinators review the work of the freelance editors and provide feedback as necessary. Furthermore, every spring, the freelance editors are invited to a day-long conference to experience a deeper dive into style and policy.

Over the years, Connie has discovered her aptitude and joy in training new freelancers and coordinators. She attributes her knowledge of AMA style to this aspect of her job. She finds that it’s more effective to provide the exact sections of the manual to new editors on their reviewed manuscripts so that they can see why changes were made and know where to look for those items in the future. Like many of your manuals, Connie’s is meticulously organized with tabs, highlights, and underlines.

On Editing Figures

One section of scientific manuscripts that can be particularly challenging to edit is figures. Because of her eye for visual representation of data, Connie was asked to take over development of chapter 4 from Stacy Christiansen, Chair of the AMA Manual of Style and Managing Editor of JAMA. Connie worked on the chapter for the last 3 years of development. Basic editing had been done, but Connie was responsible for finding good examples and, of course, making sure that those examples were edited according to AMA style.

In the process and by working with figure and statistical experts on JAMA for about a year, she gained more in-depth knowledge about which type of figures are best for representing different types of statistics and the data needed for completeness of presentation. You can see Connie’s recent AMA Style Insider post for a summary of updates to the chapter–she hopes that you find it informative and helpful!

Questions?

Please feel free to send your questions about figures and tables style to stylemanual@jamanetwork.org or @AMAManual on Twitter.–Sara Billings

Welcome the 11th Edition of the AMA Manual of Style!

We are pleased to announce the 11th edition of the AMA Manual of Style, now live at https://www.amamanualofstyle.com/ and shipping in hardcover in a few days.

The manual has been thoroughly updated, including comprehensive guidance on reference citations (including how to cite journal articles, books, reports, websites, databases, social media, and more), an expanded chapter on data display (for the first time in full color), a completely up-to-date chapter on ethical and legal issues (covering everything from authorship and open access to corrections and intellectual property), and updated guidance on usage (from patient-first language and terms to avoid to preferred spelling and standards for sociodemographic descriptors).

The section on nomenclature has undergone thorough review and updating, covering many topics from genetics and organisms to drugs and radiology.

The statistics and study design chapter has been extensively expanded, with more examples of usage and terms that link to a related glossary.

Chapters on grammar, punctuation, abbreviations, capitalization, manuscript preparation, and editing feature refreshed examples and new entries (such as allowance of the “singular they”).

The nearly 1200-page book is enriched by a variety of online features. For example, regular updates to address changes in style or policies will be featured in the Updates section. Any corrections will be made online so that you are always looking at the latest guidelines as you use the manual.

New quizzes will be posted to help new or continuing users learn to master the finer points of AMA style, and the units of measure calculator offers easy conversions between the SI system and conventional units, as well as the metric system.

We welcome questions and comments on the manual: write to stylemanual@jamanetwork.org or find us on Twitter (@AMAManual). We look forward to engaging with you. –Stacy Christiansen, for the AMA Manual of Style Committee

Patient Privacy

Sometimes before I go to bed, I like to check in on one of my favorite YouTubers, Dr Pimple Popper (the nom de internet of dermatologist Sandra Lee), who posts videos of dermatologic procedures and skin care treatments. I particularly enjoy watching videos of dilated pore extractions, and I don’t mind watching lipoma extractions either (although I do sometimes fast-forward through the excisions). I know these types of videos can get viewers’ stomachs churning a bit, but I think it’s no worse than various photographs in medical journals I have worked at over the years. And because of my occupation, I do wonder about patient privacy and anonymity.

Patients featured on this YouTube channel may have a cyst near their eye or ask for blackheads to be removed from their cheek, and their faces are clearly visible. In many videos, Dr Lee chats with her patients, and although she sometimes edits out personal details, some of it stays. Dr Lee says that patients do sign consent forms before videos are published.

Similarly, when manuscript editors of medical journals encounter photographs of patients, we must review whether the photograph might intrude on patient privacy. Authors must obtain written permission from patients (or their legally authorized representatives) for any descriptions, photographs, or videos of patients or identifiable body parts and indicate that such consent was obtained in the Methods or Acknowledgment section. When I started in this field as an editorial assistant, I processed a manuscript that described a skin lesion on a patient’s back. In an accompanying photograph, the patient’s distinctive tattoo was visible, and I needed to ask the author to either obtain patient consent or have the photograph cropped because the patient (as well as anyone who knew he had that tattoo) would be able to identify himself. Results of imaging studies and photos of laboratory slides may also have identifying information that should be removed.

Protecting patient privacy also extends to what is in the text of an article. When editing case descriptions, case reports, and personal essays, nonessential identifying data (eg, sex, specific ages, race/ethnicity, occupation) should generally be removed unless the author has permission or the information is clinically or scientifically relevant and important. Authors and editors should not falsify or fictionalize details; doing so may introduce false or inaccurate data.

Read more about patient’s rights to privacy and anonymity in section 5.8.2 of the AMA Manual of Style.—Iris Y. Lo

Get to the Point!

Here comes Hank. Too late, he’s spotted you, and now you’re in for another story—or rather, a litany of unnecessary details. “I said this, and she said that, and then I said, ‘Really!’” Hank never edits himself; he simply tells you E-V-E-R-Y-T-H-I-N-G until you’re screaming inwardly, “Get to the point!”

While editing manuscripts, I periodically encounter a “Hank” author. Every tidbit of information is important and, in his view, absolutely necessary. Along with his manuscript, which includes the maximum-allowed 5 tables and/or figures, he provides a Supplement that comprises 3 eMethods sections, an eResults, 14 eTables, and 9 eFigures. Data, data, and more data, until the Supplement resembles a closet stuffed by an 8-year-old who was told to clean her room. Everything. It’s all in there.

Consider the busy physician-reader. After perusing the array of freshly published articles in the journal website’s New Online section, she may click on Hank’s title and see that long list of supplemental material populating the scholar’s margin. However transparent the author endeavored to be by providing so much information, she doesn’t have time to read it all now; she needs summaries.

AMA style advocates that “tables and figures demonstrate relationships among data and other types of information” and that “a figure should be used if the relationships are complex….Like a paragraph, each…figure should be cohesive and focused.”

With that reader in mind, the manuscript editor reformats the author’s originally supplied figures to journal style and hones each one to present the material clearly. No chartjunk, no extraneous elements, no distracting line treatments.

Flow diagrams show the numerical progression of patients through the study: the number screened for inclusion, the number excluded for these reasons, the number enrolled, and the number at each stage, with those excluded or lost to follow-up at each stage also accounted for. The last box shows how many patients made it to the end of the study or were included in the primary analysis. From top to bottom, the progression of numbers makes perfect arithmetic sense.

Figures of multiple clinical, radiologic, or histologic images are labeled to guide the reader: before surgery, 6 months after surgery, 2 years later; magnetic resonance images of brains from patients 1 and 4; or specimens from a healthy individual and a patient with disease preceding another from the patient 1 year after treatment.

Graphs are appropriate to the data presented: bars for frequencies, data markers and error bars for summary data, forest plots for meta-analyses. All axes and ticks are clearly labeled, curves are identified by direct labeling or by the inclusion of concise figure keys, and bars and data markers are a solid color for the patients who received treatment and without color for those who received placebo. The numbers of patients at risk at each time point lend additional meaning to Kaplan-Meier survival curves. Forest plots include numerical data in addition to the illustrated plot points, with labels on either side of the graph’s vertical line at 1.0 to indicate whether each data marker’s location favored treatment or no treatment.

Back to our reader. Time is short, so she starts with the abstract. Words are read quickly, their meaning filtered through her years of accumulated knowledge and absorbed. She takes in the tables next. Row upon row of data; numbers represent baseline characteristics, laboratory results, and statistical analysis. Again, the numbers are filtered for meaning and digested for information that can help the reader treat her own patients. She studies the figures, and their meaning is immediately apparent: the bar for affected patients from one age group is taller, a survival curve is higher and longer for patients who received the lower dosage, the difference between 2 clinical images before and after treatment is obvious. No filter needed. Instantly clear. Results from years of the author’s research are visually summarized, seen by the reader, grasped, and understood.

The Supplement stands ready for closer investigation, but first the point must not be obscured. State it—illustrate it—clearly.—Connie Manno, ELS


Forest Plots: The Basics

When I was recently asked to give a presentation on forest plots at work, I was less than enthused. Figures are my least favorite part of a manuscript to edit because they usually require a lot of tedious work, and determining how to best visually present statistics makes my brain hurt. Forest plots in particular had become the subject of my nightmares leading up to the time of preparation of my presentation after a few experiences with editing unwieldy ones. However, thanks to being subjected to presenting on forest plots, I’ve gained some basic knowledge that I thought I would share.

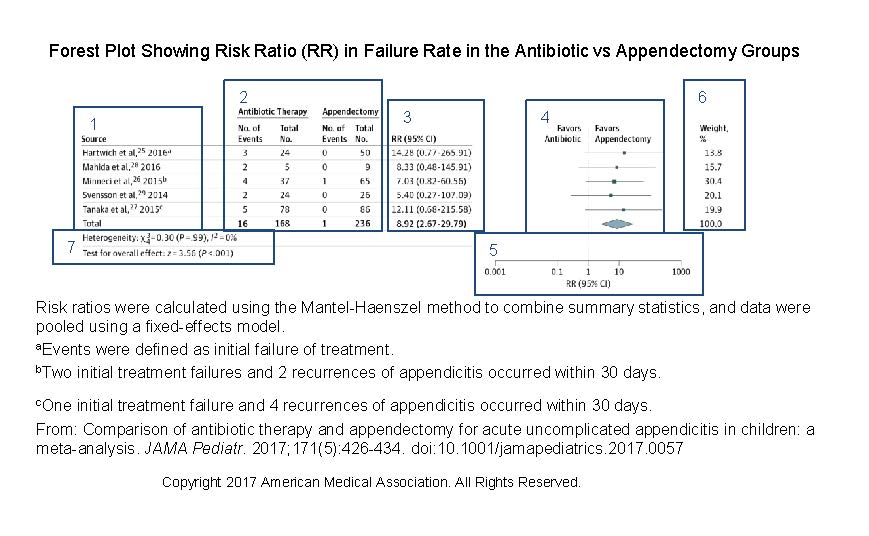
There are a few types of forest plots, namely those presenting the results of meta-analyses and those presenting subgroup analyses. Here, I will focus on a forest plot for a meta-analysis. In a meta-analysis, a forest plot acts as a visual representation of the results of the individual studies and the overall result of the analysis. It also shows overall effect estimates and study heterogeneity (ie, variation in results in the individual studies). A forest plot for ratio data should include the following data:

  1. The sources included in the meta-analysis, with citations. If the source author or study name is listed more than once, query the author to ensure that the study samples are unique; overlapping samples would lead to inaccurate estimates. Also, remember to renumber the references if you have renumbered them in the body of the article.
  2. The number of events and total number of participants in each group of the study and in the combined studies.
  3. Risk ratio and 95% CI for each study and overall.
  4. Graphed relative risk and 95% CI, with top labels describing what data markers on either side of the null line mean. The squares represent the results of each study and are centered on the point estimate, with the horizontal line in the center representing the 95% CI. The diamond shows the overall meta-analysis estimate, with the center representing the pooled estimate and the horizontal tips indicating the confidence limits.
  5. Log scale for the x axis with a label indicating the measure.
  6. Percentage of weight given to the study. Weights are given when pooled results are presented. Studies with narrower confidence intervals are weighted more heavily.
  7. Heterogeneity and data on overall effect.

(Open image in a new tab to see more detail.)

The caption should indicate the test and model (fixed or random effects) used in the evaluation and may include an explanation of the meaning of the different marker sizes.

If you follow these basic rules, forest plots are a breeze. —Sara M. Billings